
MANUFACTURING
A 0.65 MW battery on a process load
Battery 0.65 MW / 1.2 MWh
On site 280 kWp PV
Markets FCR, plus day-ahead and PV optimisation behind the meter
Closed Q1 16% above the business case.
TRANSPARENCY INSTEAD OF PROMISES
For every battery we take on, we write a business case before go-live and publish how close the site came. Three Belgian batteries, three sectors, first quarter of 2026. Including the one that came in under plan.
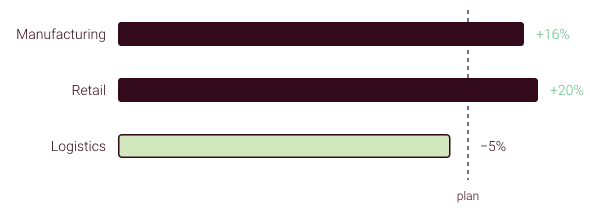
Projection versus reality
Q1 is the hardest quarter to look good in. January and February are low revenue months, and so are November and December. That is exactly why we publish this one.
MANUFACTURING
Battery 0.65 MW / 1.2 MWh
On site 280 kWp PV
Markets FCR, plus day-ahead and PV optimisation behind the meter
Closed Q1 16% above the business case.
Retail
Battery 0.22 MW / 0.45 MWh
On site 280 kWp PV
Markets FCR, plus day-ahead and PV optimisation behind the meter
Closed Q1 20% above the business case.
Logistics
Battery 3.0 MW / 12 MWh
On site 4 MWp PV
Markets FCR and VPP, plus day-ahead and PV optimisation behind the meter
Closed Q1 5% below the business case. Reserve prices came in lower than modelled, lower costs absorbed most of the gap.
Why two identical batteries earn differently
The battery is not the variable. The way it is operated is. Five levers decide the outcome.
01
Intraday, FCR and aFRR together instead of one market, so the asset moves to wherever the value is that day.
02
Cutting the quarter-hour peaks that set your grid costs, alongside the market strategy rather than instead of it.
03
Using your own solar production at the moments it is worth the most.
04
A contract without day-ahead exposure cancels out part of the result. You pay the difference between your monthly average and the day-ahead price for every MWh the battery delivered.
05
Pooling delivers roughly 25% more than the same battery standing alone.
The lever most owners miss
Two checks before a battery goes live. Is the site exposed to the day-ahead price, and does your supplier support a Transfer of Energy setup. Where consumption is stable and predictable, imbalance exposure is worth looking at as well. We advise on this before go-live, and your contract stays yours.
What you can check
✓ Monthly results, published every month
✓ Every case measured against the business case we wrote before go-live
✓ The quarters that came in under plan, published with the rest
.
That is how large the gap can be between two identical batteries. Entirely driven by operation: multi-market access, peak shaving and alignment with your energy contract.